Sections 01–06
01
Adobe's Fiscal Calendar02
What You're Building Each Month03
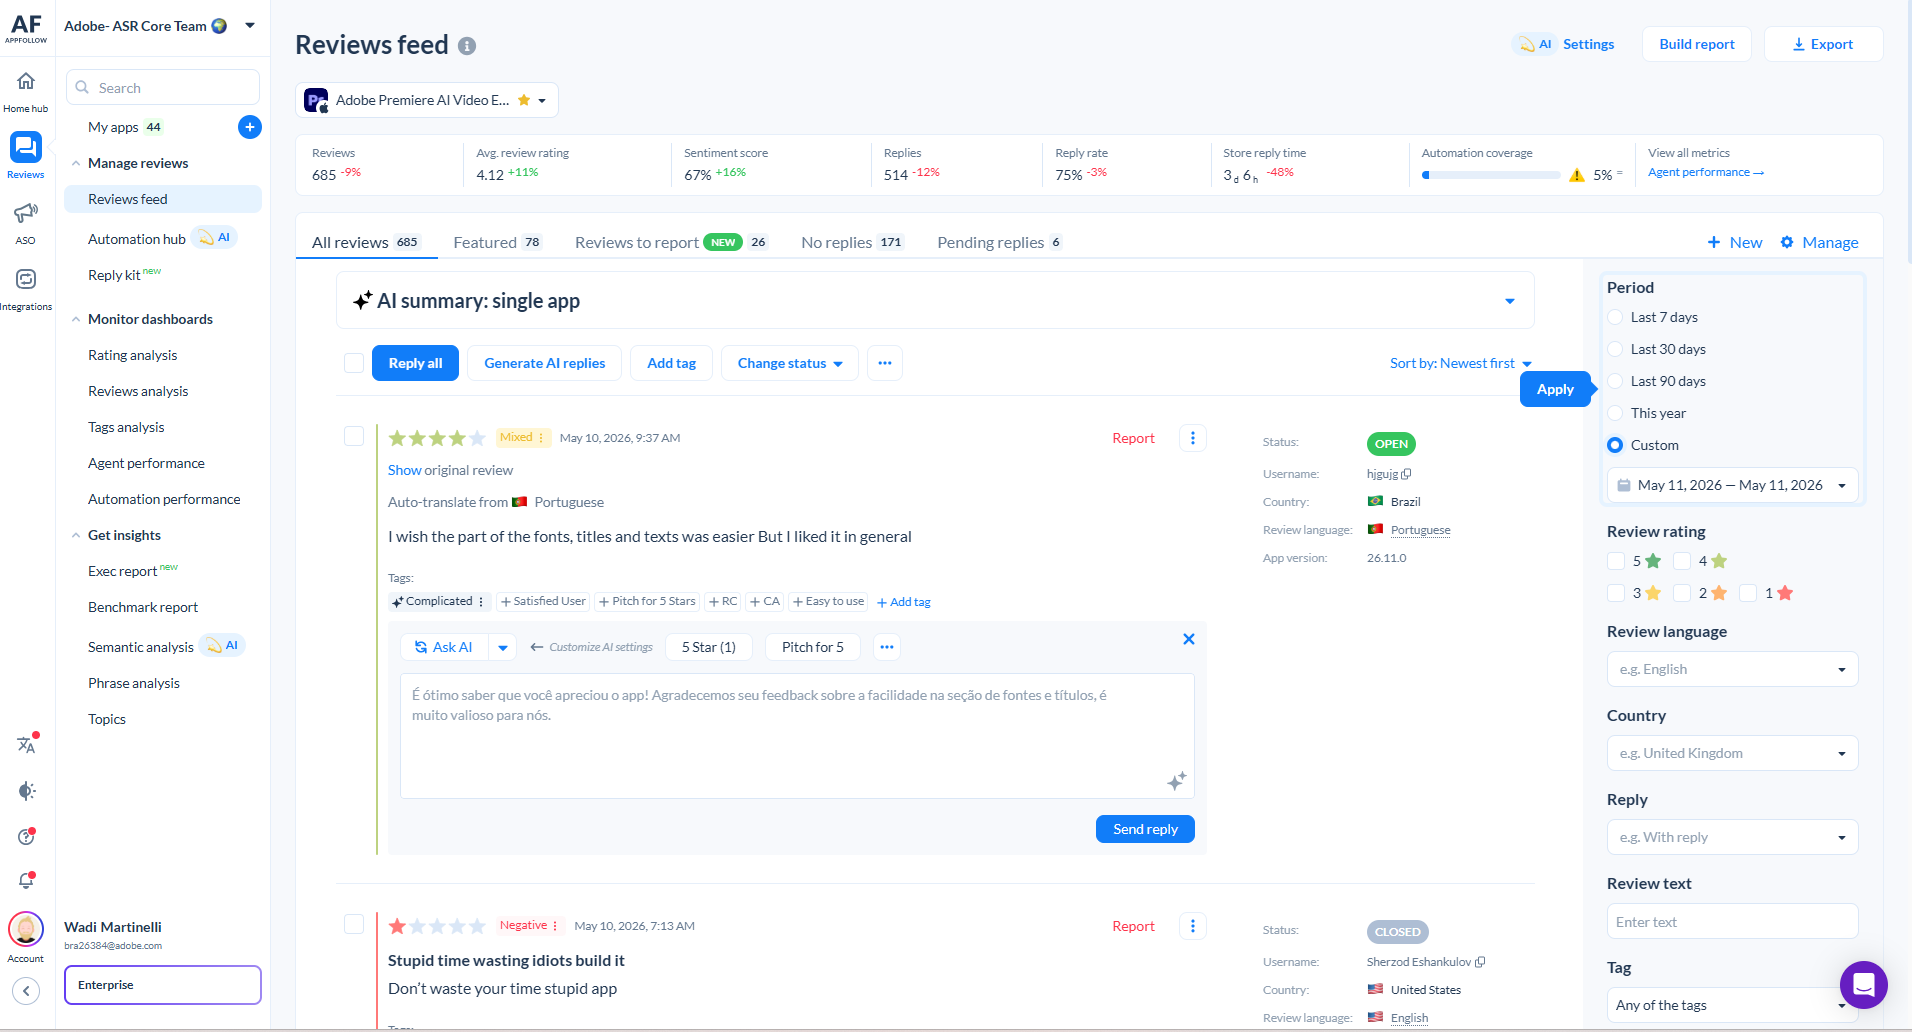
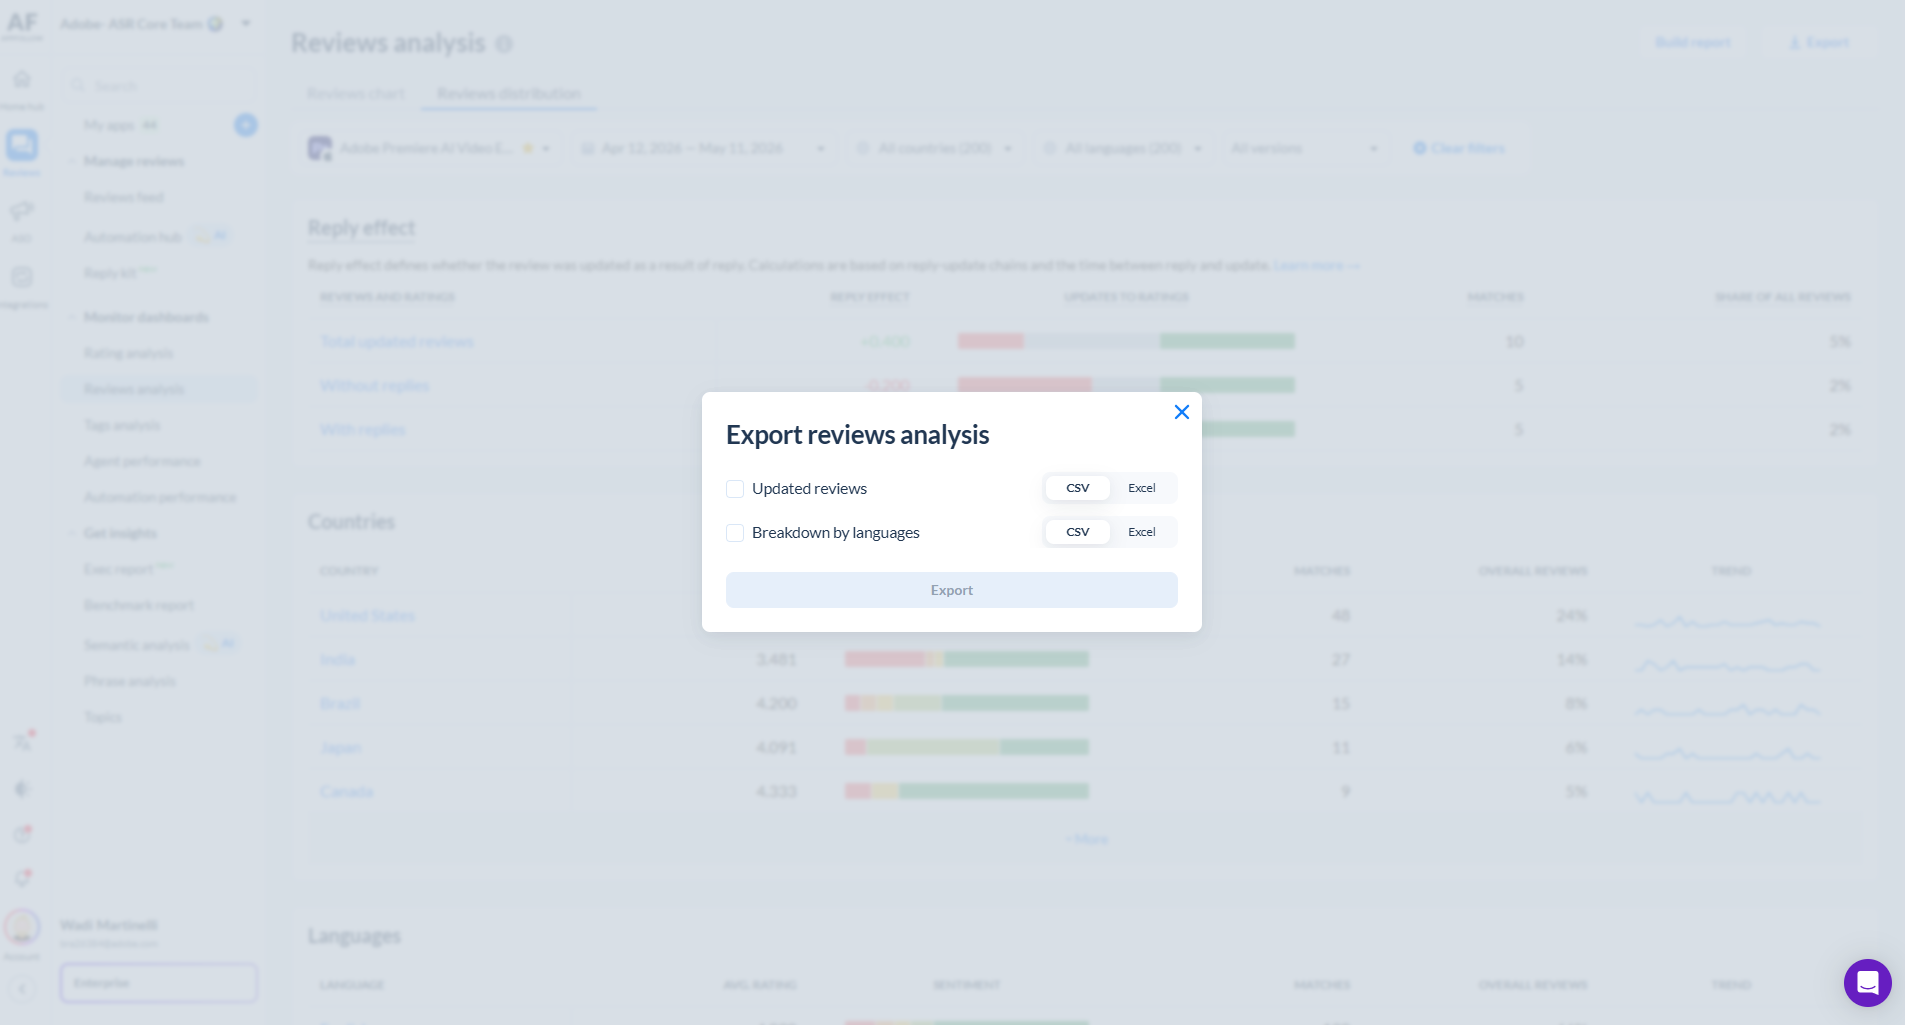
Phase 1 — Pull AppFollow Exports04
Phase 2 — Extract Numbers with LLM05
Phase 3 — Fill in the Data Entry Sheet06
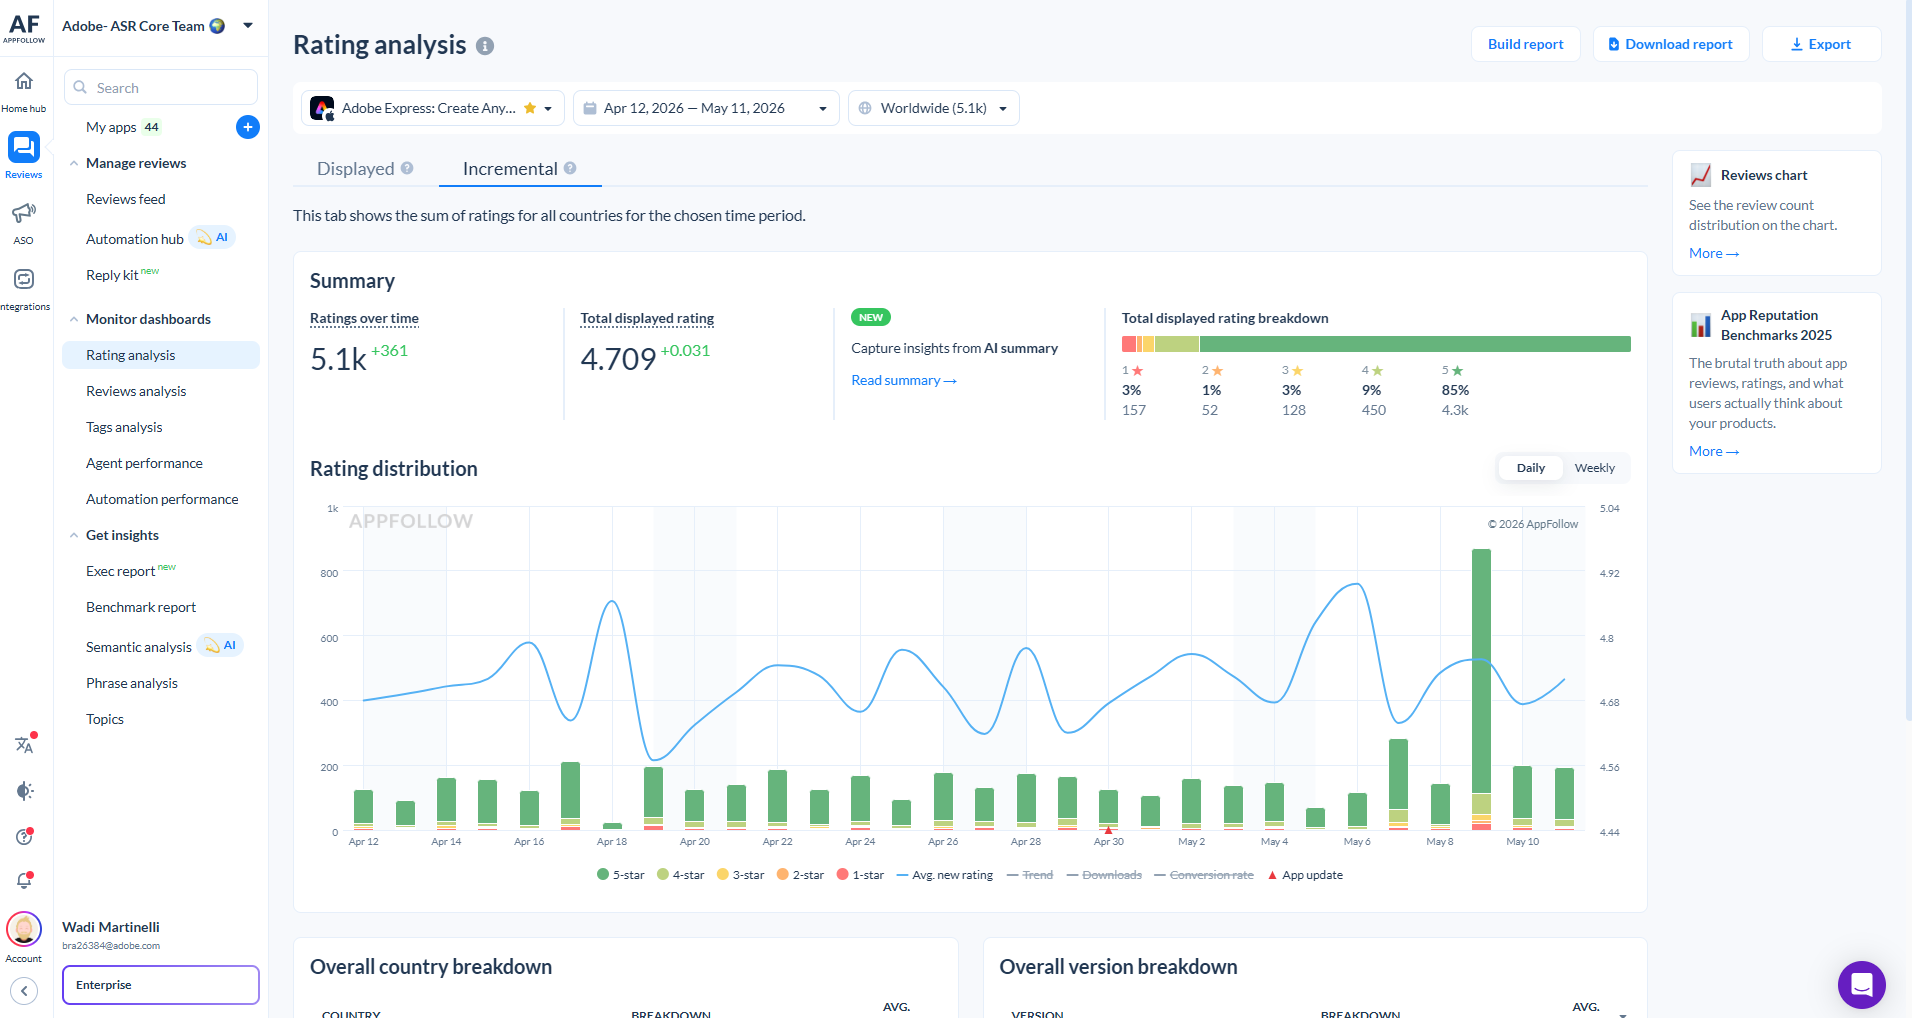
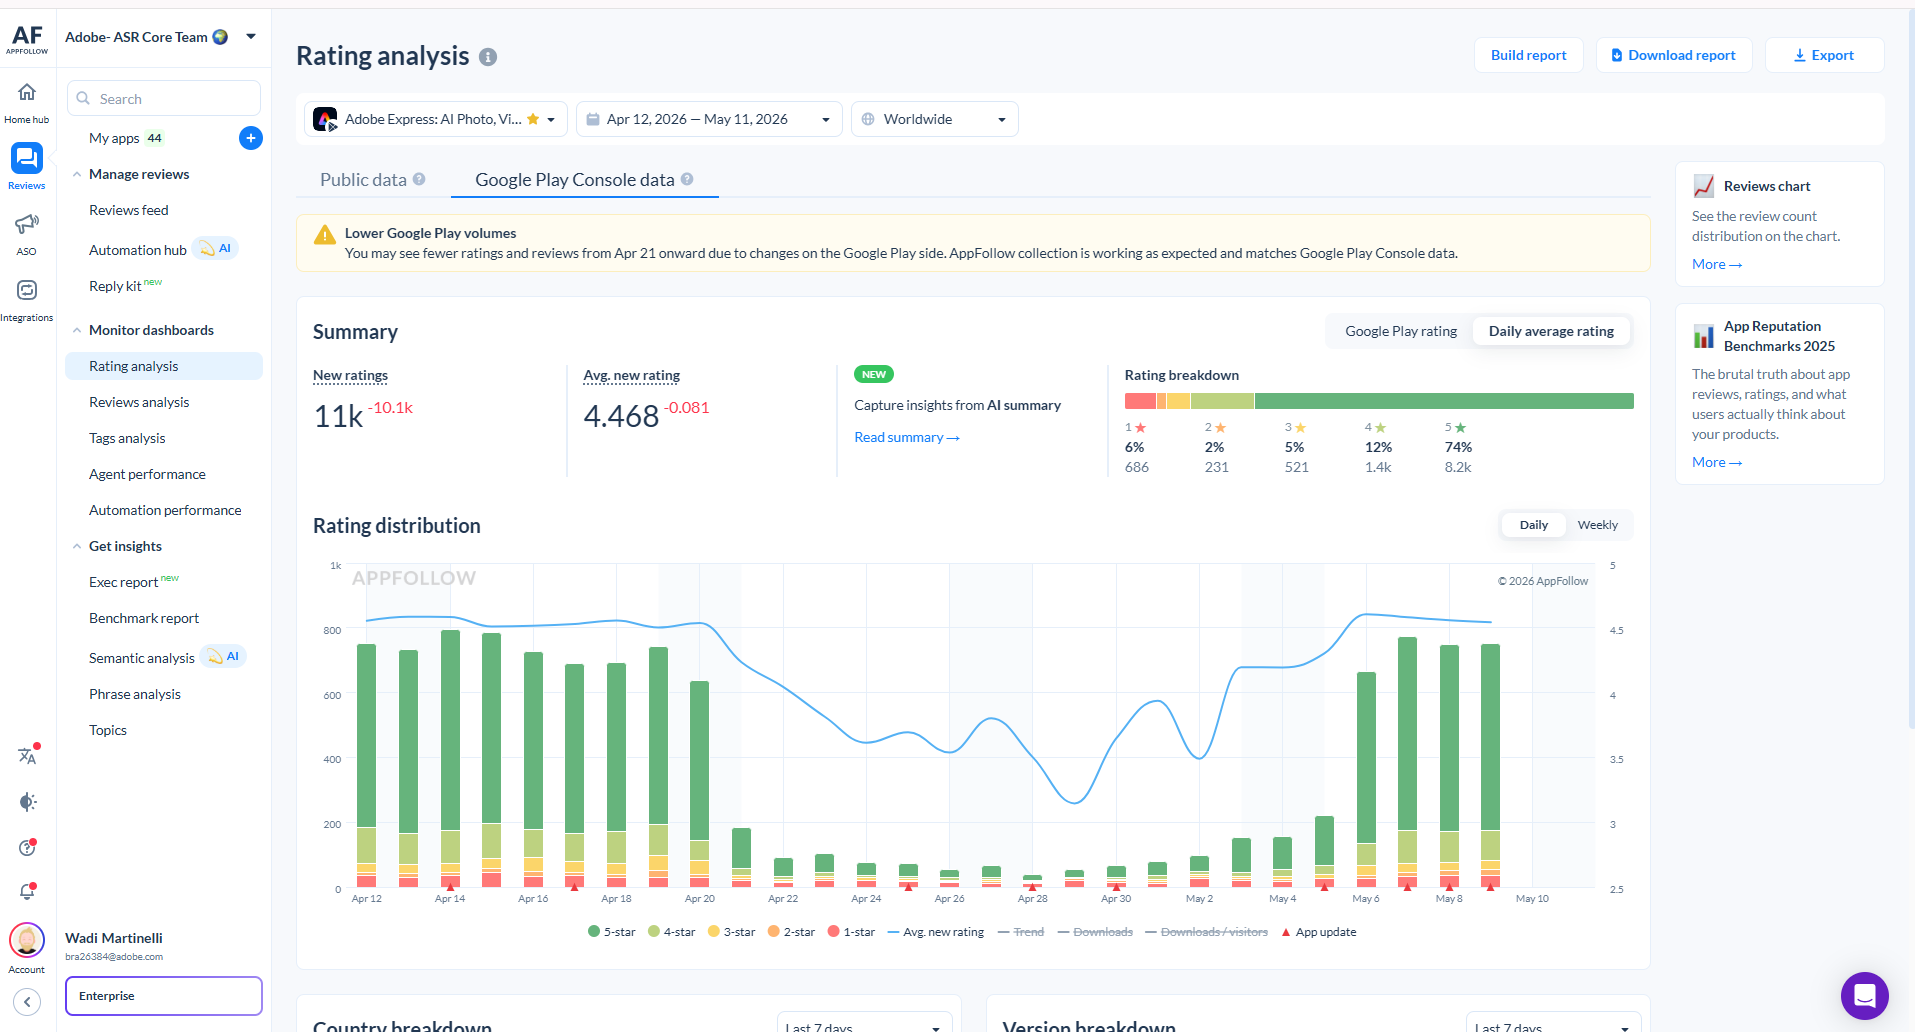
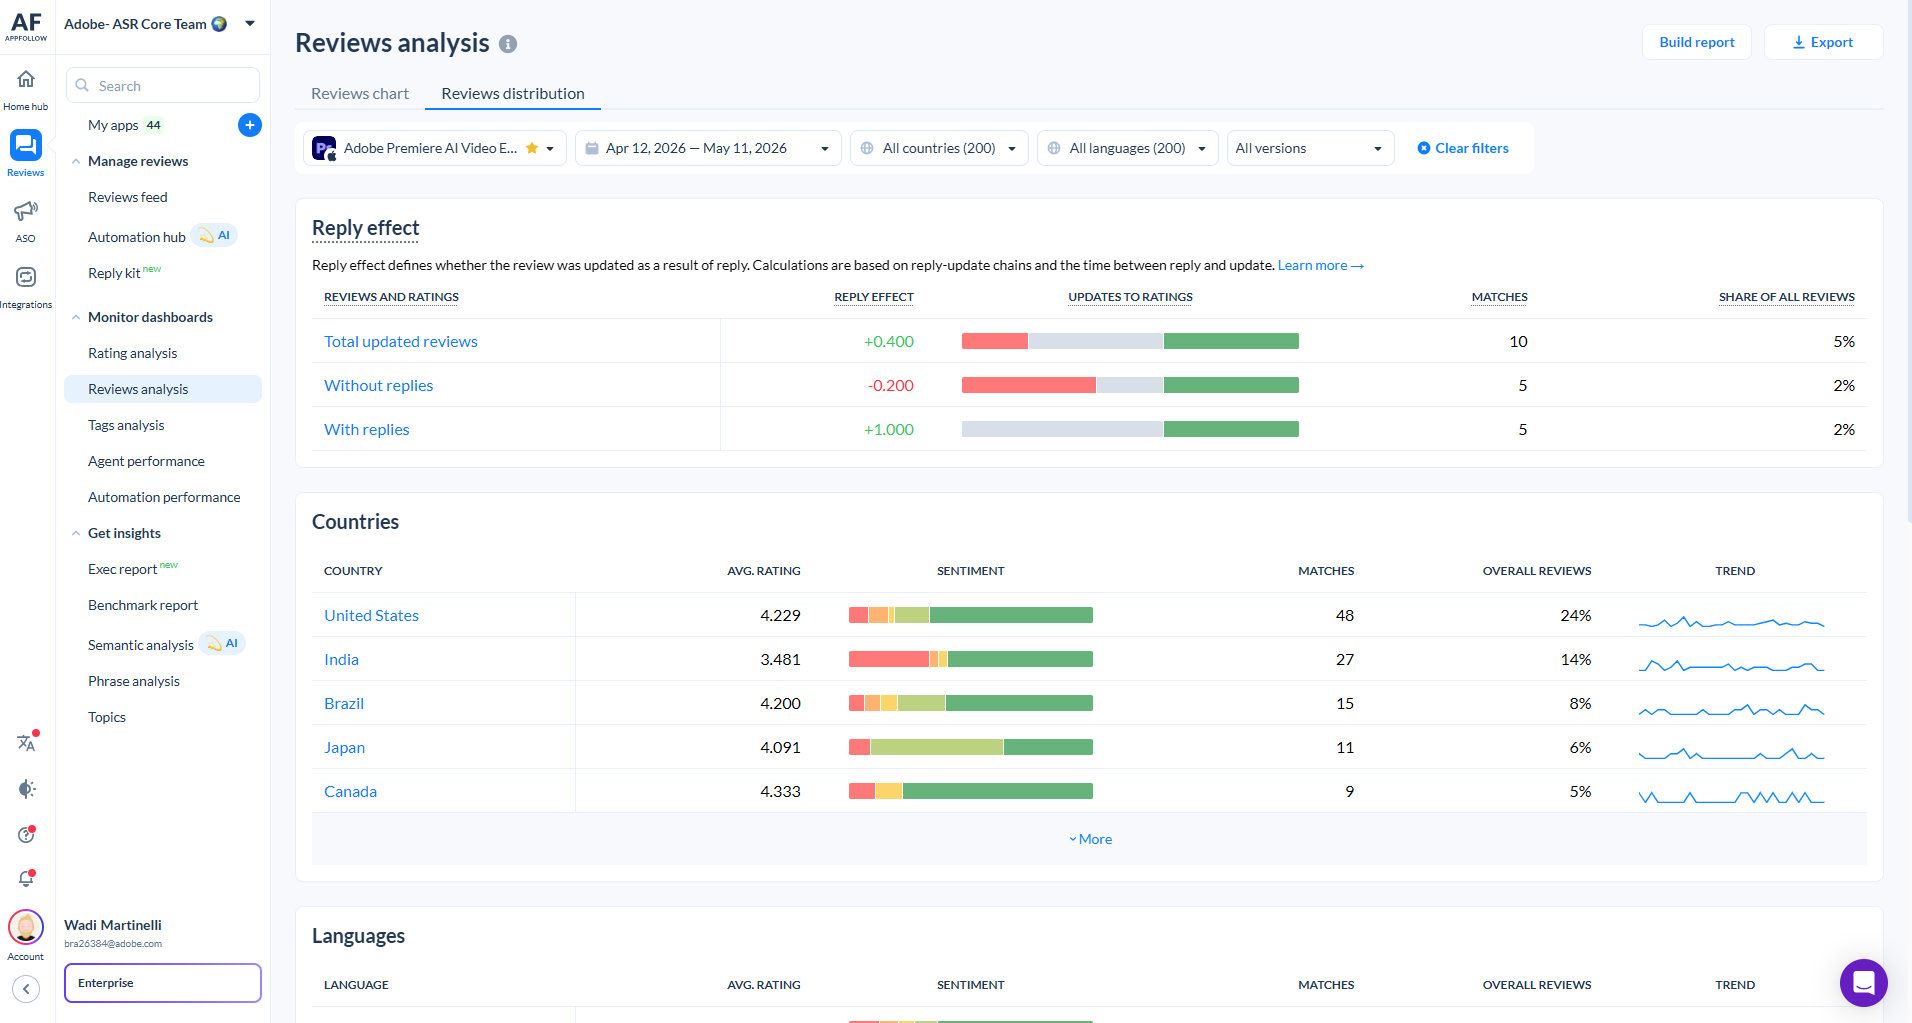
Phase 4 — Update the Tracker TabsSections 07–11
07
Phase 5 — Update the PPT Deck08
Quality Checks Before Sending09
Troubleshooting Common Issues10
Future Automation Roadmap11
Monthly Checklist